


According to restaurant consultants interviewed by Restaurants USA magazine, re-designing your menu can improve your sales on average from 2 to 10 percent.
Use the methods below to achieve a more profitable menu. Read More
According to restaurant consultants interviewed by Restaurants USA magazine, re-designing your menu can improve your sales on average from 2 to 10 percent.
Use the methods below to achieve a more profitable menu. Read More
A Modern Performance Framework for Scalable, Investable Restaurant Brands
By Robert Ancill
The Next Idea – Restaurant Consultants (TNI)
 Why Restaurants No Longer Fail Quietly
Restaurants don’t collapse overnight anymore. They erode. Margins thin. Labor churns. Guests still come, but they spend less, complain more, forgive less, and quietly disengage. By the time the P&L reflects the damage, the brand is already behind the curve.
For investors, franchisors, and multi-site operators, this presents a clear truth:
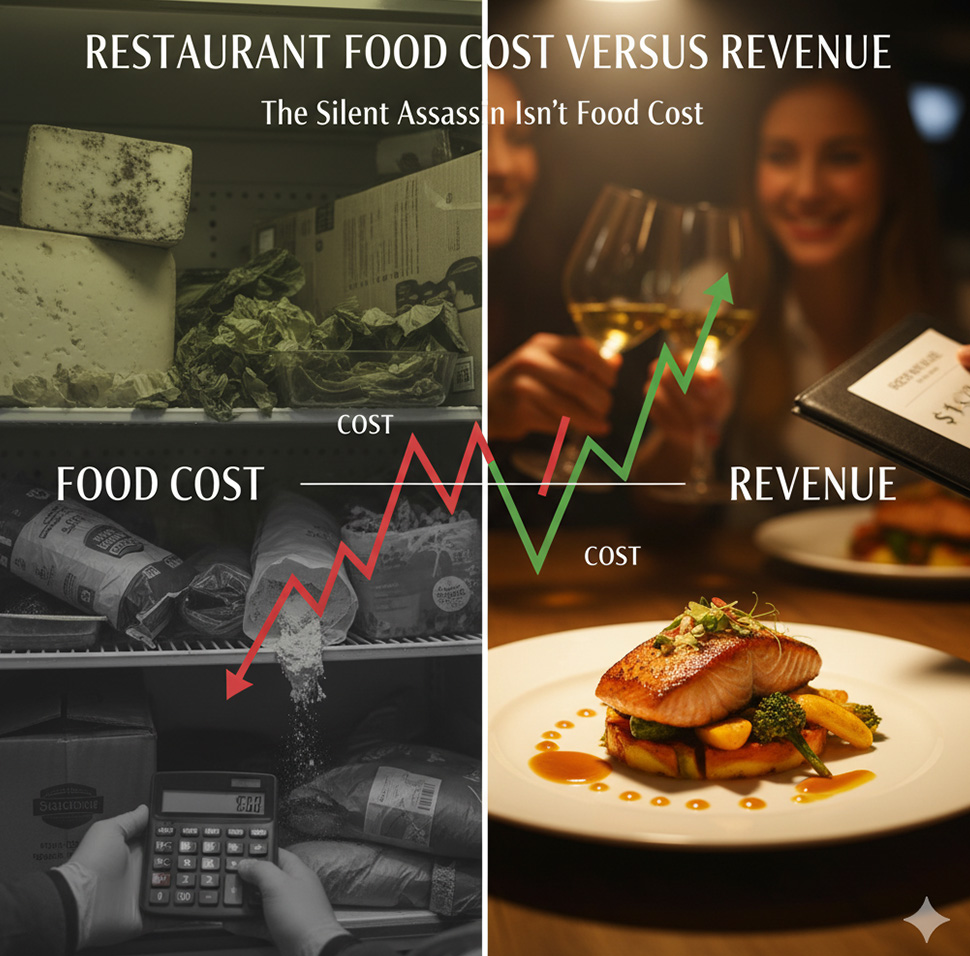
The greatest risk in hospitality is not cost, it is delayed awareness.
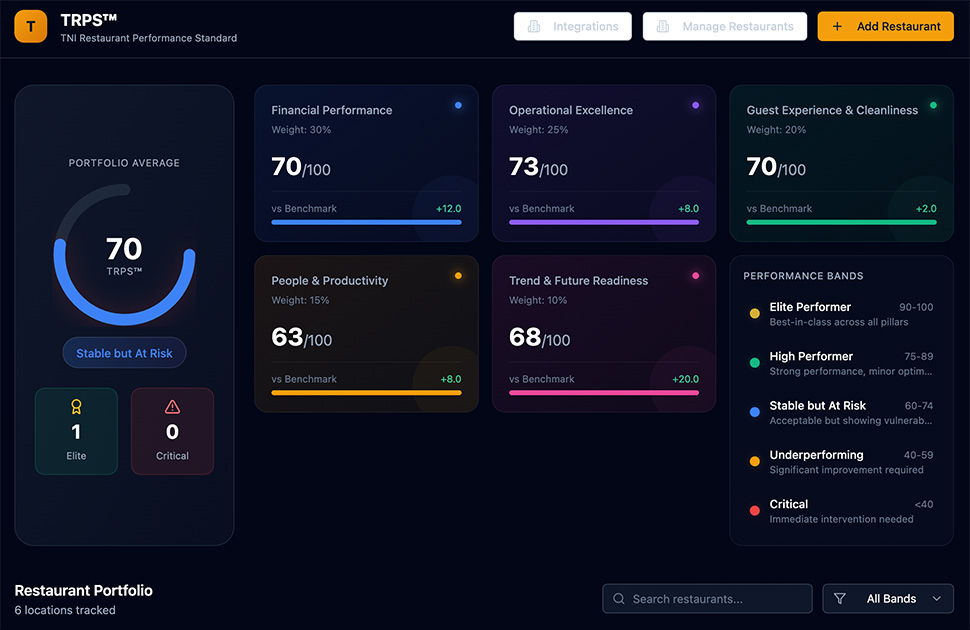
Key Performance Indicators (KPIs), when used properly, are not reporting tools. They are early-warning systems. But only if they evolve beyond basic cost control and start measuring guest tolerance, relevance, and future readiness.
This article outlines a modern KPI framework produced by The Next Idea (TNI) to help restaurant brands scale profitably, protect relevance, and make decisions with confidence.
 The KPI Problem No One Talks About
Most restaurant groups already track KPIs. The problem isn’t absence of data, it’s misplaced focus.
Traditional KPIs answer questions like:
Modern operators need answers to far more dangerous questions:
At TNI, we see the same pattern repeatedly:
Operators manage efficiency. Investors need predictability. Franchisors need repeatability.
KPIs must serve all three.
TNI structures KPIs across four interconnected pillars:
People – Labor, leadership, and culture stability
Product – Menu, margin, and kitchen discipline
Place – Flow, conversion, and revenue efficiency
Perception – Guest tolerance, brand relevance, and trend alignment
Together, these pillars move KPIs from historical reporting to strategic foresight.
Labor remains the largest controllable expense in hospitality, but also the most misunderstood. Investors often focus on wage percentages without recognizing that instability is more expensive than pay rates.
| Segment | Wage Cost % | Total Labor % | Annual Turnover |
| QSR | 22–28% | 25–32% | 80–120% |
| Casual Dining | 28–35% | 32–40% | 60–90% |
| Premium | 35–45% | 40–55% | 40–70% |
Investor Insight:
High turnover is not a labor problem, it is a systems and leadership risk that erodes consistency, brand trust, and unit economics.
Menu profitability does not happen by accident. It is the result of disciplined inventory management, menu engineering, and variance control.
Many concepts fail while “busy” because sales volume masks margin leakage.
| Segment | Food COGS % | Beverage GP % | Stock Holding |
| QSR | 25–30% | 65–75% | 3–5 days |
| Casual Dining | 28–33% | 68–78% | 5–7 days |
| Premium | 30–38% | 70–82% | 7–10 days |
Investor Insight:
Popularity is not profitability. The most dangerous menu items are best-sellers with poor contribution margins.
 3. PLACE PERFORMANCE
Revenue growth is rarely limited by demand alone. It is constrained by:
This is where strong concepts outperform average ones, even in the same location.
| Segment | ASPH (Relative) | RevPASH Focus |
| QSR | Low–Mid | Throughput |
| Casual Dining | Mid | Turn + Attach |
| Premium | High | Yield per Seat |
Investor Insight:
RevPASH exposes whether growth is driven by pricing power, flow discipline, or operational luck.
The KPIs That Predict Decline, or Defend Value
This is where most restaurant groups under-measure, and over-estimate safety.
TNI Customer Tolerance Index (CTI)
CTI measures how much operational or pricing friction guests will tolerate before reducing frequency, spend, or advocacy.
It assesses tolerance for:
Why it matters:
Two brands can raise prices. Only one retains demand. CTI explains why.
Trend Mapping tracks how well a concept aligns with:
This is not about chasing trends. It is about avoiding irrelevance.
A structured audit assessing:
Investor Insight:
Most restaurant failures are relevance failures, not operational ones.
KPIs do not create value.
Early decisions do.
The role of KPIs is to:
At TNI, KPIs are not dashboards. They are risk-management tools for growth capital.
Weekly:
Labor %, COGS %, RevPASH, Sales Mix
Monthly:
Variance analysis, staff turnover, ASPH, CTI movement
Quarterly:
Trend Mapping Score, Trend Audit Rating, Brand relevance review
 Final Thought
The restaurants that survive the next decade will not be the cheapest, the busiest, or the loudest. They will be the ones that measure what matters before it becomes obvious. That is the difference between operating restaurants, and building investable brands.